 Course Duration: 5 days, including lecture-based modules and hands-on exercises
Who Should Attend: Development and exploration geologists, geophysicists, petrophysics and log analysts, reservoir and drilling engineers, managers, and technical personnel
Course Summary: The dipmeter is unfortunately one of the least utilized interpretation tools available to the geoscientist, despite widespread structural and stratigraphic applications. Thus, this course is designed to provide participants with a detailed understanding of dipmeter and borehole image acquisition, interpretation techniques, and data integration into geologic and geophysical models. In addition to classic wireline image logs (electrical and ultrasonic acoustic), participants will be exposed to the latest image logging technology, including high-resolution LWD real-time images (gamma ray, density, PEF, electrical, propagation resistivity, and acoustic), as well as a number of conventional and unconventional interpretation and visualization techniques. Applications and data integration will include structural and stratigraphic/sedimentological interpretation including dip analysis, wellbore stability and geomechanics including common pitfalls of stress orientation analysis, geosteering and reservoir navigation aspects including thickness logs, and cement and casing evaluation. Using an applied “hands-on” approach, participants will be exposed to a diversity of world-wide case examples with complementary exercises, both of an individual and group nature.
- Image Log Types – Stuck on wireline FMI? Try full 360° LWD high-resolution electrical, azimuthal resistivity, gamma ray, density, acoustic, and photoelectric logs.
- Visualization – Simple manipulations to advanced 4D visualization maximizes interpretation and understanding, from the technical analysts to managerial levels.
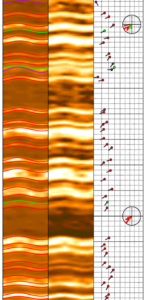
- Structure and stratigraphy – Get the most of those dipmeter logs and image logs, including advanced structural analysis and stratigraphic/sedimentalogical investigation.
- Wellbore Stability – Understand the pressure system and borehole response to safely guide the bit to the target.
- Geosteering and Reservoir Navigation – Take the guess work out of reservoir navigation by understanding the full capabilities of modern full 360° LWD image logs.
- Data Integration – Incorporation of both modern LWD image logs and wireline images into the overall data stream of other geological, geophysical, petrophysical and engineering data sets is a must for truly understanding the petroleum system.
You Will Learn To:
- Understand the available image log types and current state of technology
- Understand the fundamentals of dip determination and analysis
- Understand the application of image logs in structural and stratigraphic studies
- Understand the role of image logs in geomechanical and wellbore stability analysis
- Integrate image log data into multidisciplinary studies
COURSE OUTLINE FOR 5 DAYS:
DAY 1
- Welcome and Introduction
- History of Well Imaging
- General Concepts
- Image Log Development and Presentation, Tool Technology (Theory and Examples), and General Applications
- Image Log QC, Processing, and Artifacts
- QC and Processing Aspects, and Examples of Common Image Log Artifacts
- Dip Determination
- Types of Dip (True, Apparent, and Relative), Image Log Patterns, and Examples
- Practical Examples and Exercises
DAY 2
- Visualization
- Simple PowerPoint and Paper Copy Manipulations, Tube and 3D Displays, and Image Log Movies
- Structural Interpretation
- Fractures, Faults, and Folds, Dipmeter Interpretation, and Data Integration
- Fracture Characterization
- Fracture Types, Development of Fracture Model from Integrated Datasets, Natural versus Induced Fractures, Fracture Permeability or Seal, and Stylolites
- Practical Examples and Exercises
DAY 3
- Wellbore Stability
- Stress Conditions, Differential Stress around the Wellbore, Induced Tension Fractures, Breakout, and Wellbore Trajectory
- Stratigraphic/Sedimentologic Interpretation
- Classic Dipmeter Examples, Microresistivity Curve Correlation, Sedimentological Aspects, Facies Analysis, and Thin Bed Analysis
- Practical Examples and Exercises
DAY 4
- Continuation of Wellbore Stability and Stratigraphic/Sedimentologic Interpretation
- Azimuthal Petrophysical Analysis
- Petrophysical Variations around the Wellbore, Time-Averaged Curve versus Sector Curves, Averaging (Mean, Weighted, Dip Corrected), RSTRIKE Sector Extraction, Nodule Identification and Quantification, Vugular and Fracture Porosity, and Impact of Relative Dip (Resistivity Inversion and Sector Selection)
- Practical Examples and Exercises
DAY 5
- Continuation of Azimuthal Petrophysical Analysis
- Reservoir Navigation and Lateral Well Placement
- Key Datasets, Reservoir Navigation, and Thickness Logs
- Cement and Casing Evaluation
- Practical Examples and Exercises
Course is designed from an applied standpoint, with numerous examples and hands-on exercises from the petroleum industry.